Plot a 'report' summarising indicators for both short- and long-term model quality objectives
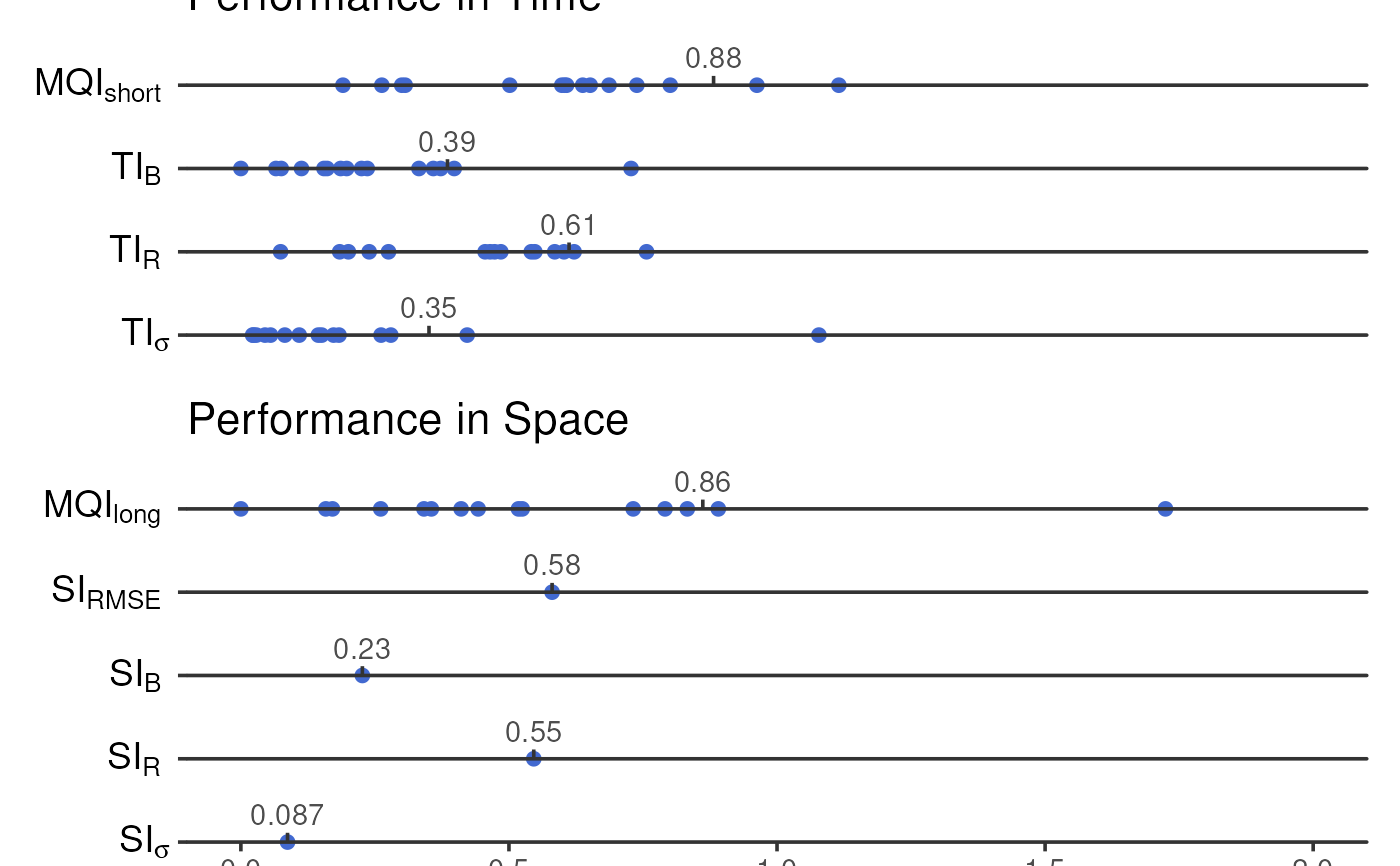
plot_mqi_report.RdThis function produces a series of one-dimensional scatter plots reporting all of the spatial and temporal indicators, as well as the MQIs, contained within short- and long-term statistics objects. In non-interactive plots, a dotted vertical line indicates the 90th percentile (for MQIs & TIs) or maximum (for SIs) values for each statistic.
Usage
plot_mqi_report(
  stats,
  stats2 = NULL,
  color_fixed = "#4269D0",
  color_indicative = "#EFB118",
  color_outline = "black",
  color_target = "green4",
  censor = 2,
  show_annotations = FALSE,
  title = NULL,
  interactive = FALSE,
  gp = grid::gpar(fontsize = 10)
)
Arguments
- stats, stats2
The output of
summarise_mqo_stats(). All relevant information (e.g.,term,params_fixed, etc.) will be passed to this function from the statistics object.statsis compulsory andstats2optional. If both are provided,statsandstats2should be different terms (one short and one long). In that case, short-term stats are plotted preferentially but the long-term stats will be annotated ifshow_annotations = TRUE.- color_fixed, color_indicative, color_outline
The colours to use for fixed data, indicative data, and any another annotations. Can be expressed as hex codes, or any colours listed in
colors().- color_target
The colour to use for highlighting the target range for each statistic (always
0to1). This colour will recieve an alpha value of0.15to ensure the scatter markers are still visible against it.- censor
The maximum value to show in the 'report'. Any values above this will be reduced to this value. The default,
2, is twice the size of the objective of1and is appropriate for most use cases.- show_annotations
Should the figure be annotated with input parameters and complementary performance indicators? These are useful extra detail, but can overcrowd the plotting area.
- title
An optional title for the plot. This will appear directly above the plot area, regardless of whether
interactiveisTRUEorFALSE.- interactive
If
FALSE, the default, a staticggplot2graphic will be returned which can be saved as a PNG, SVG, or other similar format. IfTRUE, a dynamic HTML widget will be returned created byplotly.- gp
A
grid::gpar()object passed togrid::textGrob(), used to control the appearance of the parameter & indicator annotations whenshow_annotations = TRUE.fontsizeis likely the most useful argument, but many options are available throughgrid::gpar(). Only thefontsizeargument is used wheninteractive = TRUE.
Value
a patchwork assemblage
See also
Other plotting functions:
plot_comparison_bars(),
plot_mqi_bars(),
plot_mqi_scatter(),
plot_timeseries()
Examples
long <- summarise_mqo_stats(demo_longterm, pollutant = "PM10")
#> ! term assumed to be 'long'.
#> ℹ If this is incorrect, please specify the data's term using the term argument.
#>
#> ! Using fixed long-term annual pm10 parameters.
#> ℹ If this is incorrect, please use `mqor::mqo_params()` or
#>   `mqor::mqo_params_default()` to construct a parameter set.
#>

short <- summarise_mqo_stats(demo_shortterm, pollutant = "PM10")
#> ! term assumed to be 'short'.
#> ℹ If this is incorrect, please specify the data's term using the term argument.
#>
#> ! Using fixed short-term daily pm10 parameters.
#> ℹ If this is incorrect, please use `mqor::mqo_params()` or
#>   `mqor::mqo_params_default()` to construct a parameter set.
#>

plot_mqi_report(short, long)