Code Recipes
recipe.RmdThis article contains self-contained recipes for using mqor to evaluate data against model-quality objectives.
Create Target Diagrams
Obtain Test Dataset
The code in this section could be replaced by any method for getting “MQOR-format” data into R.
# create temporary directory
tmp <- tempdir()
# download demo files
download_demo_files(dir = tmp)
# format for mqor
data_short <-
read_mqor(
file_data = file.path(tmp, "delta_shortterm.csv"),
file_attributes = file.path(tmp, "delta_attributes.csv")
)
data_long <-
read_mqor(
file_data = file.path(tmp, "delta_longterm.csv"),
file_attributes = file.path(tmp, "delta_attributes.csv")
)
# need to create our variable dictionary
dict <- mqo_dict(site = "stat_abbreviation")
# make sure every observation has a corresponding modelled value, and vice-versa, and ensure short-term data meets minimum DC%
data_short <- validate_mod_obs_pairs(data_short) |>
validate_coverage(resolution = "hourly", min_coverage = 0.75, dict = dict)
#> ℹ Using stat_code to label sites. Use the `dict` argument with the
#> `mqor::mqo_dict()` function to change this.
#> ℹ Using stat_code to label sites. Use the `dict` argument with the
#> `mqor::mqo_dict()` function to change this.
#> ℹ Using stat_code to label sites. Use the `dict` argument with the
#> `mqor::mqo_dict()` function to change this.
data_long <- validate_mod_obs_pairs(data_long)
#> ℹ Using stat_code to label sites. Use the `dict` argument with the
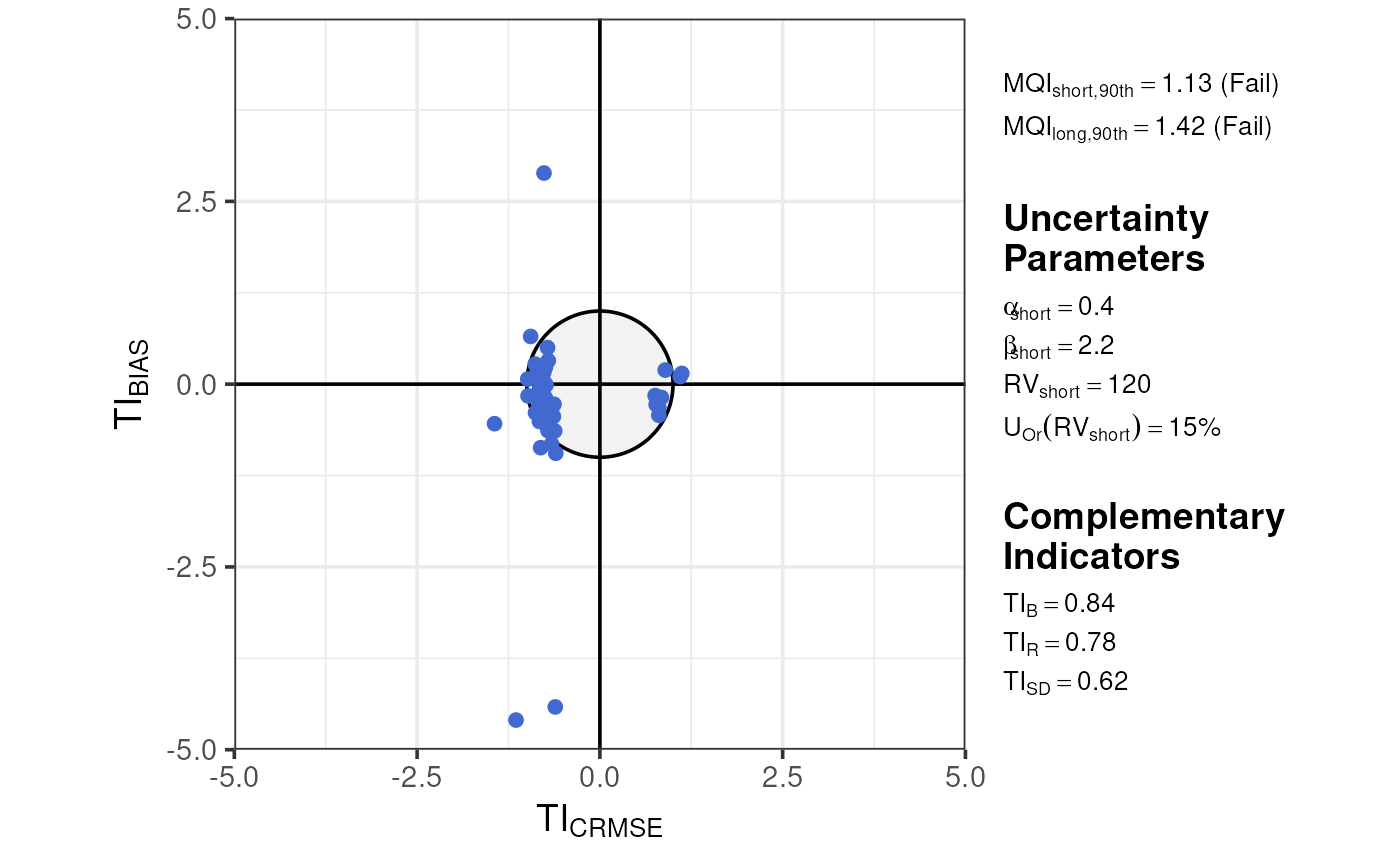
#> `mqor::mqo_dict()` function to change this.Nitrogen Dioxide (Hourly)
# create no2 stats
no2_stats_short <-
  summarise_mqo_stats(
    data_short,
    pollutant = "NO2",
    term = "short",
    dict = dict
  )
#> ℹ Using stat_code to label sites. Use the `dict` argument with the
#>   `mqor::mqo_dict()` function to change this.
#> ! Using fixed short-term hourly no2 parameters.
#> ℹ If this is incorrect, please use `mqor::mqo_params()` or
#>   `mqor::mqo_params_default()` to construct a parameter set.

no2_stats_long <-
  summarise_mqo_stats(
    data_long,
    pollutant = "NO2",
    term = "long",
    dict = dict
  )
#> ℹ Using stat_code to label sites. Use the `dict` argument with the
#>   `mqor::mqo_dict()` function to change this.
#> ! Using fixed long-term annual no2 parameters.
#> ℹ If this is incorrect, please use `mqor::mqo_params()` or
#>   `mqor::mqo_params_default()` to construct a parameter set.

# create target diagram
plot_mqi_scatter(no2_stats_short, no2_stats_long)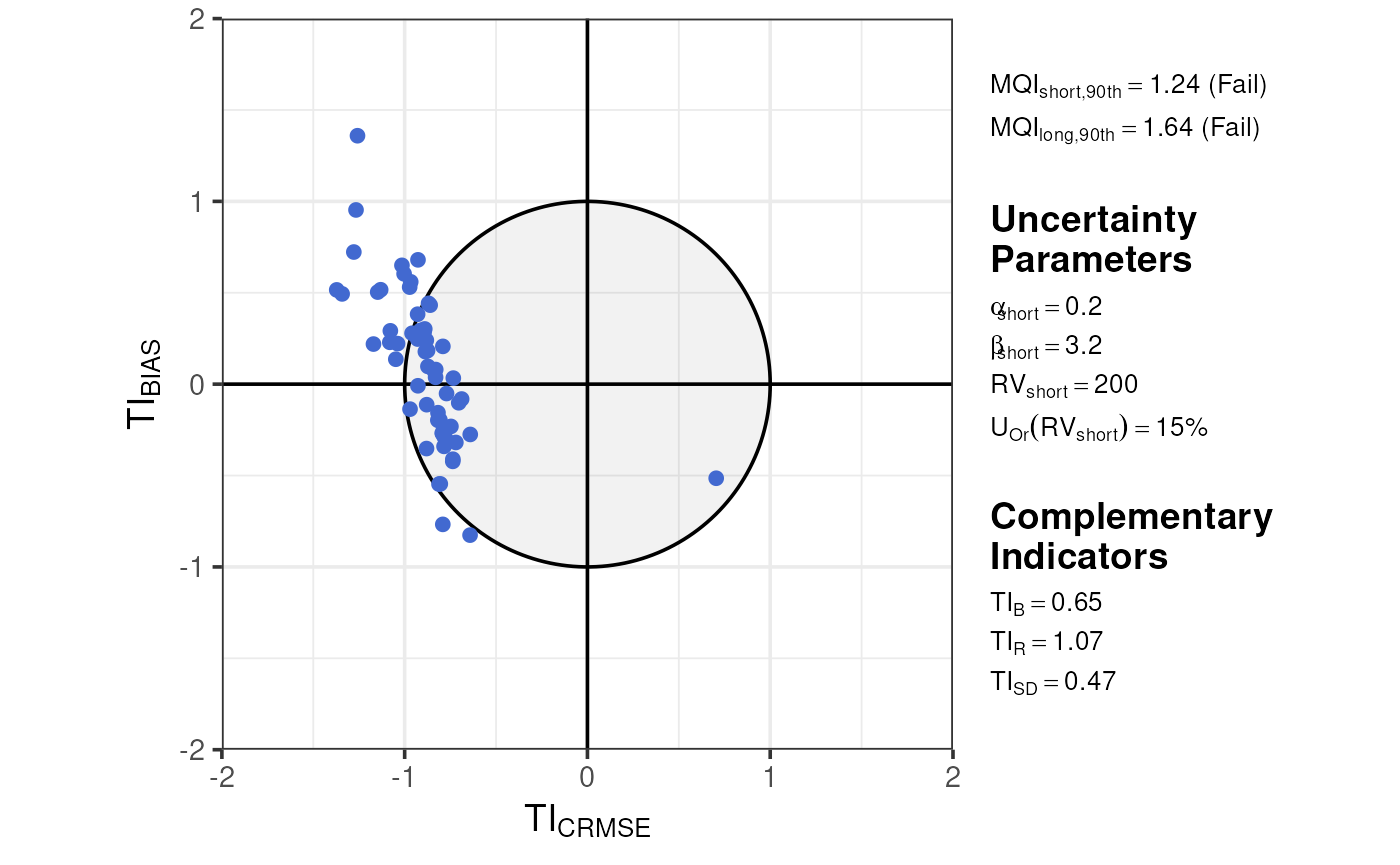
Particulate Matter (Daily)
# get mean daily data
data_daily <-
  data_short |>
  summarise_daily(statistic = "mean")
#> ℹ Using stat_code to label sites. Use the `dict` argument with the
#>   `mqor::mqo_dict()` function to change this.

# create statistics objects
pm10_stats_short <-
  summarise_mqo_stats(
    data_daily,
    pollutant = "PM10",
    term = "short",
    dict = dict
  )
#> ℹ Using stat_code to label sites. Use the `dict` argument with the
#>   `mqor::mqo_dict()` function to change this.
#> ! Using fixed short-term daily pm10 parameters.
#> ℹ If this is incorrect, please use `mqor::mqo_params()` or
#>   `mqor::mqo_params_default()` to construct a parameter set.

pm10_stats_long <-
  summarise_mqo_stats(
    data_long,
    pollutant = "PM10",
    term = "long",
    dict = dict
  )
#> ℹ Using stat_code to label sites. Use the `dict` argument with the
#>   `mqor::mqo_dict()` function to change this.
#> ! Using fixed long-term annual pm10 parameters.
#> ℹ If this is incorrect, please use `mqor::mqo_params()` or
#>   `mqor::mqo_params_default()` to construct a parameter set.

# create target diagram
plot_mqi_scatter(pm10_stats_short, pm10_stats_long)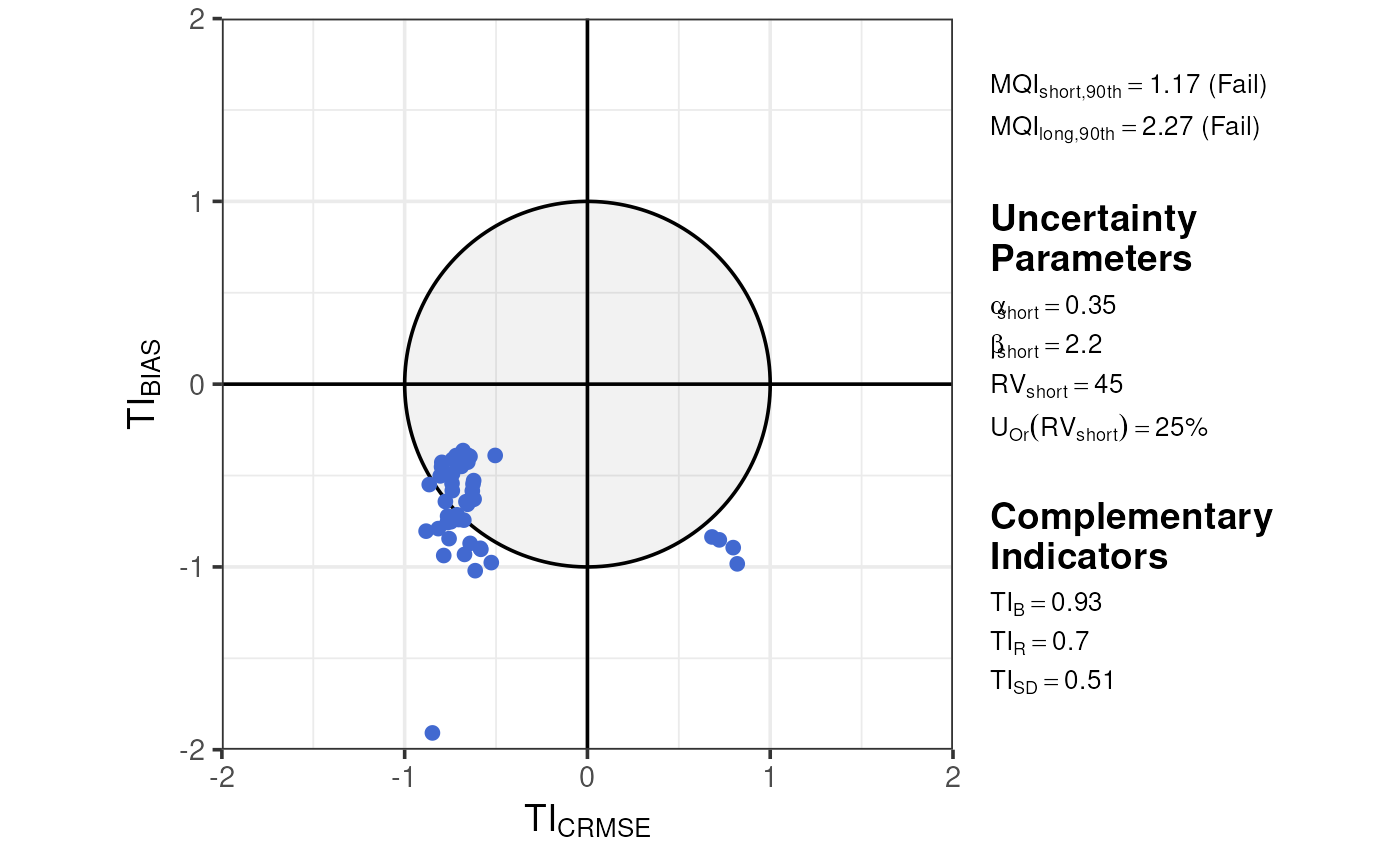
Ozone (Max Daily 8hour)
# get 8 hour rolling ozone, then get daily max
data_8hr <-
  data_short |>
  mutate_rolling_mean(window_size = 8L) |>
  summarise_daily(statistic = "max")
#> ℹ Using stat_code to label sites. Use the `dict` argument with the
#>   `mqor::mqo_dict()` function to change this.
#> ℹ Using stat_code to label sites. Use the `dict` argument with the
#>   `mqor::mqo_dict()` function to change this.

# need a "seasonal" average for ozone - lets call it May to July
data_seasonal <-
  data_short |>
  filter_month(months = 5:7) |>
  summarise_annual()
#> ℹ Using stat_code to label sites. Use the `dict` argument with the
#>   `mqor::mqo_dict()` function to change this.
#> ℹ Using stat_code to label sites. Use the `dict` argument with the
#>   `mqor::mqo_dict()` function to change this.

# create statistics objects
o3_stats_short <-
  summarise_mqo_stats(
    data_8hr,
    pollutant = "O3",
    term = "short",
    dict = dict
  )
#> ℹ Using stat_code to label sites. Use the `dict` argument with the
#>   `mqor::mqo_dict()` function to change this.
#> ! Using fixed short-term max daily 8hr mean o3 parameters.
#> ℹ If this is incorrect, please use `mqor::mqo_params()` or
#>   `mqor::mqo_params_default()` to construct a parameter set.

o3_stats_long <-
  summarise_mqo_stats(
    data_seasonal,
    pollutant = "O3",
    term = "long",
    dict = dict
  )
#> ℹ Using stat_code to label sites. Use the `dict` argument with the
#>   `mqor::mqo_dict()` function to change this.
#> ! Using fixed long-term seasonal o3 parameters.
#> ℹ If this is incorrect, please use `mqor::mqo_params()` or
#>   `mqor::mqo_params_default()` to construct a parameter set.

# create target diagram
plot_mqi_scatter(o3_stats_short, o3_stats_long)